State of Charge: a boring topic? [The Battery Cycle #3]
Below, a contribution fromClaudius Jehle, CEO of volytica diagnostics GmbH*.It’s the third of a series of knowledge articles (a cycle, indeed) on a series of topics around Li-Ion Batteries,written by Claudius and other field-related experts.Feedbacks, questions and contributions are welcome (at info@sustainable-bus.com) In our last article, we explained both parallels and differences of the various subspecies of Li-Ion batteries […]
Below, a contribution from
Claudius Jehle, CEO of volytica diagnostics GmbH*.
It’s the third of a series of knowledge articles (a cycle, indeed)
on a series of topics around Li-Ion Batteries,
written by Claudius and other field-related experts.
Feedbacks, questions and contributions are welcome (at info@sustainable-bus.com)
In our last article, we explained both parallels and differences of the various subspecies of Li-Ion batteries such as NMC, LFP and LTO. The underlying basic principle is always the same, which we explained using the – to some extent ironical, but essential very helpful – analogy of parachuters for ions, congesting at the exit of their vessel (aka anode) during discharge, their adventurous and cumbersome travel through electrolyte and separator, their crowding during landing and finally slowly migration into and settling in the opposite electrode (aka cathode).
Today we will stay figurative to explain the seemingly boring topic State of Charge (SOC) and give some interesting insights and take-aways. In fact, it is surprisingly difficult for the electronics (which we will refer to as BMS, battery management system) to determine the SOC even if these systems have signals like cell voltages, currents and temperatures directly at hand.
State of Charge: basically content per capacity
Unfortunately, our microscopic (i.e. on atom/ion level) parachuter analogy becomes clumsy when explaining a macroscopic effect like SOC – so think of a glass with a certain liquid content (trillions of parachuters). The maximum content we call capacity*. The SOC is simply content per capacity, i.e. 150ml in a 300ml glass results in 50% SOC.
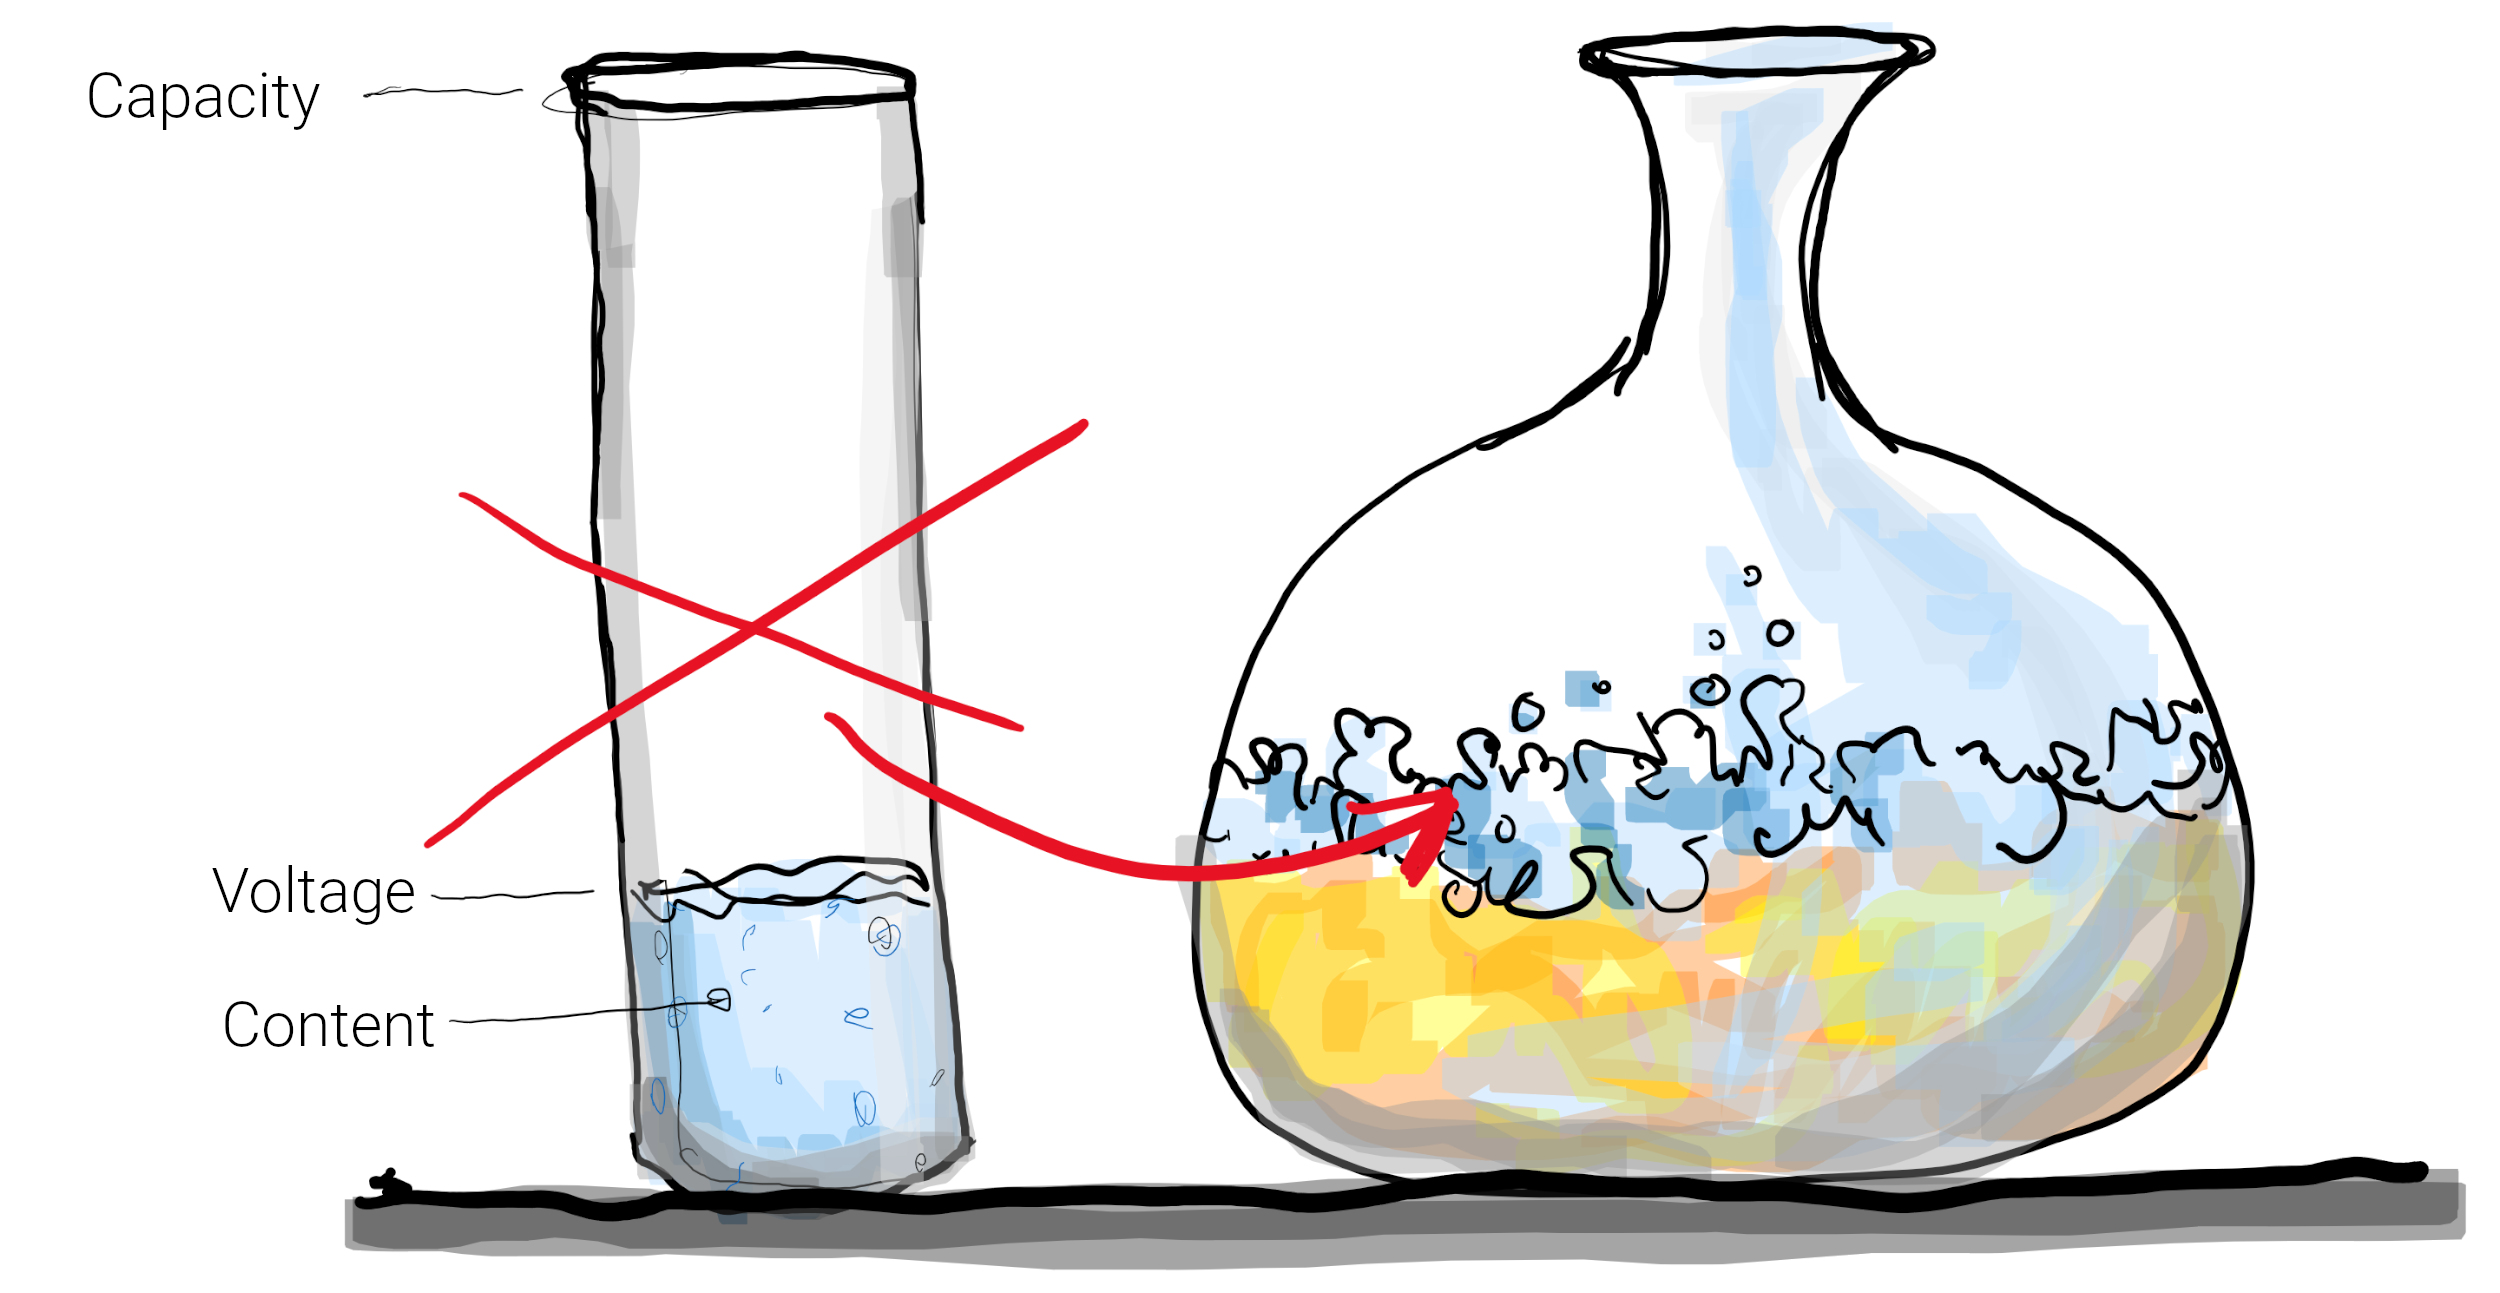
But as said: the BMS only measures voltage (filling height) and current (milliliter per second) and thus has to estimate the content indirectly. Simple if the glass has a cylindrical shape and the liquid is water – you pour an unknown amount in and measure the height. With a cylindrical shape, the SOC is simply content height per maximal height (3cm of max. 10cm is 30%, and 9cm is 90%).
Determining SOC is not an easy task
But batteries are not such water glasses. Firstly, the “glass shape” is highly irregular and manifold across chemistries. To get images into your head, LFP looks like a broad, bellied, bulbous wine decanter and NMC has rather an elongated candy-shape (narrow, fairly straight, narrow). While the lookup-table to translate height (voltage) to content can quite simply be determined one time by the manufacturer in the lab and programmed into the BMS**, one can easily imagine the major challenge during operation: 5mm of height in the belly-part can be a good 20 or 30% of total liquid content!
In fact, LFP is so broad that between c. an SOC of 20 to 90% the voltage virtually doesn’t change. The slightest measurement error can result in extreme SOC errors.
Degradation: A huge problem is that during degradation, the glass shrinks (in width, almost not in height!). But not always uniformly and certainly not nicely predictable. The BMS has to adapt the lookup table, which is even more complicated. This issue (“SOH”) will be addressed in the following articles!
What if battery content is made of… beer?
But the second issue is that we’re not talking about water – we’re talking about beer. Every time liquid is flowing in or out, foam is forming. The height and decay stability greatly varies with chemistry, with temperature, with the flow pattern, with flow direction, with SOC (yes, SOC quality depends on SOC, to make it worse), age and so on.
Remember the parachuters decelerating before congesting at the entrance, where they slowly migrate into the cathode/anode? This trillion-fold slow migration into and subsequently within the host material on a microscopic scale is directly visible on a every-day scale: after an operation phase the voltage signal is contaminated for 10, sometimes 30 minutes and – in extreme cases such as low temperatures and/or low SOCs – even some hours before every parachuter found their nest in the host lattice (this steady state is called open circuit voltage (OCV) condition).
Using a non-relaxed voltage can make SOC estimation a jeopardy, especially in the ‘sensitive’, i.e. bellied, voltage ranges. Very straightforward result: During operation, the voltage cannot*** be used for SOC estimation by the BMS.
Estimating State of Charge during operations
So how is SOC estimated during operation, then? By having a ‘trustable’ starting point and, starting from there, adding/subtracting the amount of current going in and out (i.e., counting trillions of parachuters) by a doorman, and in times, resetting during breaks again, because the doorman will inevitably miscount during long operation times (“drift”).
Balancing: A battery system comprises hundreds of cells, and the BMS has to calculate a SOC for each and every cell – but may only communicate 1 value to the outside world. For several reasons (one being the said challenges) cells are not drained homogeneously, making this endeavour an almost unsolvable collision of goals. We will learn about that in the next article on balancing, symmetry and inhomogeneity!
What is the impact? We will dig a bit deeper in the following articles about the most detrimental effects, namely sudden standstill (“sudden depletion events”) and inhomogeneous degradation, but one thing is universal: we estimate the average SOC error to be somewhere between 5-10%, reaching up to 10-20% in e.g. low-cost systems, high-duty (few breaks) applications and especially LFP/LTO systems. This is significant – a battery that’s off by 10% and is still working is, basically, 10% oversized!
Best practices for an accurate SOC
Action items and best practices for an accurate SOC:
- high-quality products (e.g. hi-accuracy voltage and current sensors)
- periodic and sufficiently long breaks (for resetting and, consequently, balancing)
- particularly for LFP/LTO applications: these resetting and balancing breaks should be at >80% SOC to be outside the “belly region”, making it tremendously easier for the BMS to function, e.g. after charging. But: high standstill SOC is one of the most detrimental degradation facilitators. Depending on the cell chemistry, there is a sweet-spot somewhere between 80-100%. Ask your supplier or, rather, an independent expert for directions.
Bonus: Ever wondered why fast-charging is fast only in the first 80%? 80% in 20mins, but the last 20% in another 20mins? The core reason is not artificial manipulation by the charging system or the vehicle to keep degradation low. Ever poured a glass of beer using a tap? 80% in no time, but for the last 20% you need to reduce the current to keep the foam from spilling over. No joke: The ions can just not migrate into the electrode fast enough, so charging current needs to be reduced to allow the congestion to dissolve. The fuller the electrode, the slower the migration, the more current reduction, …
* sometimes people talk of capacity when referring to the actual content (“the battery is almost full, it has 98% capacity”) – we discourage that and keep it nicely separate.
** this characteristic lookup table is often called OCV-curve (“open circuit voltage”)
*** sophisticated models exist to estimate the amount of foam and compensate the voltage for it, but we want to keep it simple here

